
CFOs can turn an Excel macro into an app
Welcome to the new CFO stack 🔥

Every finance team has one: the legendary Excel macro that runs your cost allocations.
For us, it was a spreadsheet that distributed overhead based on store-level net sales. It worked, but barely. Manual and painful.

We turned an old spreadsheet into a live, interactive finance control tower using
Google Sheets
Firebase Studio (It’s insane)
One single prompt
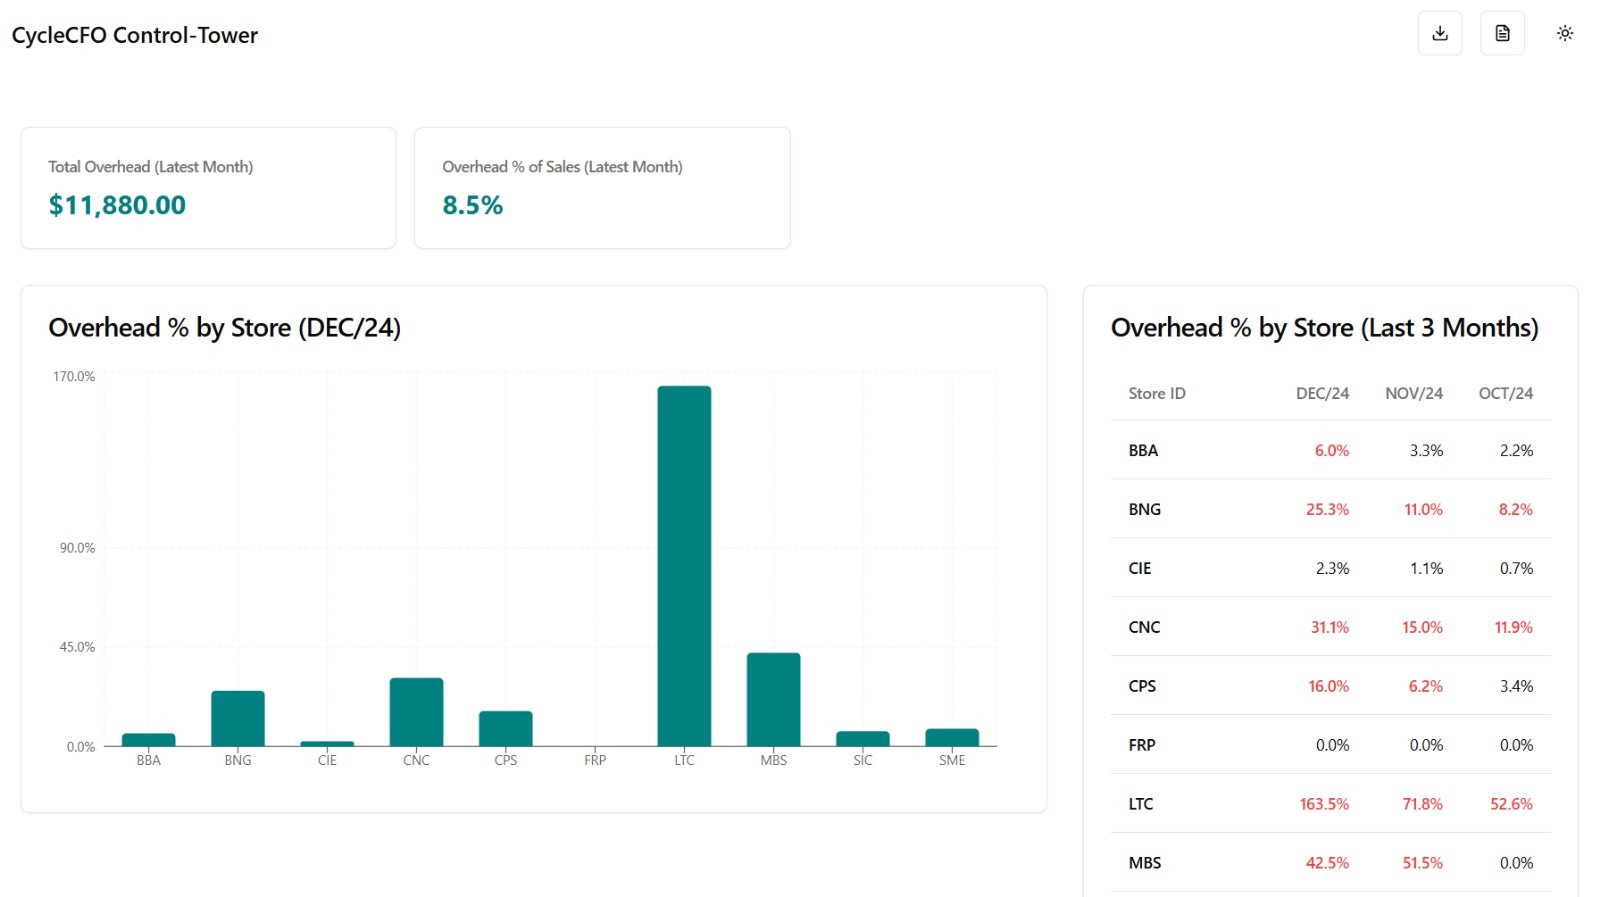
We called it the CycleCFO Control-Tower.
Here's how we did it, and how you can too in 4 simple steps.
Read on.
Step 1: Start With the Macro
The original Excel file calculated this:
allocatedOverhead = backofficeOverhead × (storeNetSales / totalNetSales)It allocated overhead costs across stores based on their net sales share. The formulas worked, but the usability didn’t.
We have a traditional Excel macro that does a static allocation of overhead costs based on net sales. We want to turn this into a web app using Firebase.
Add a function where the user can override the standard allocation percentages by dragging the columns inside a column chart.
And by dragging 1 specific store up or down, the rest of the store allocations should reallocate.
