
How to find anomalies and build narrative reports with AI in 5 minutes instead of 5 hours
I used M365 Copilot in Excel to find anomalies and create a narrative using the =LABS.GENERATIVEAI() function.

I opened Excel. I asked Copilot to highlight the top 3 anomalies in a financial statement. I used the =LABS.GENERATIVEAI() function.
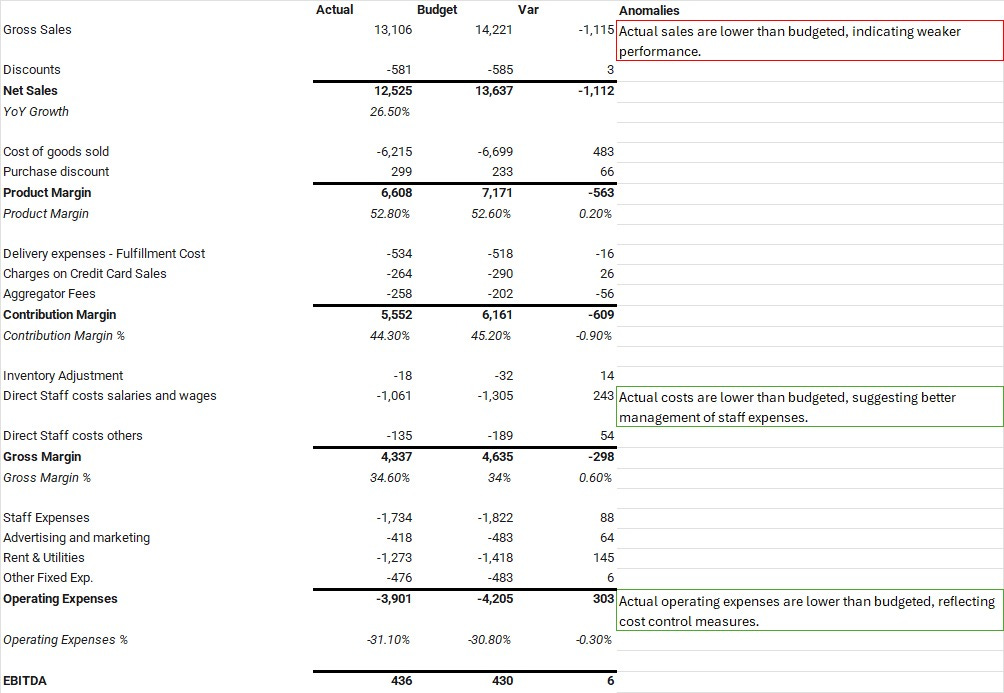
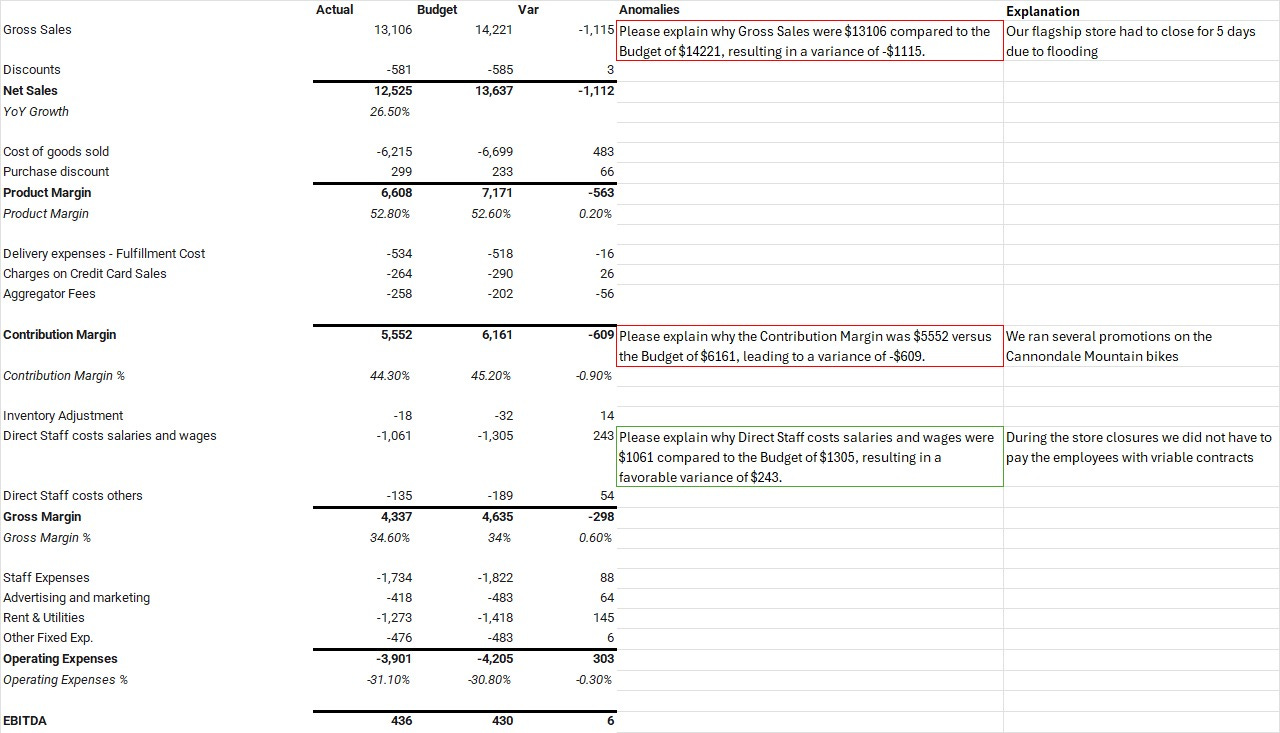
Copilot pulled out the most unusual variance accounts and asked the user to give an explanation.
From there, I simulated a complete financial storytelling process:
I provided quick narrative input on each anomaly detected by copilot.
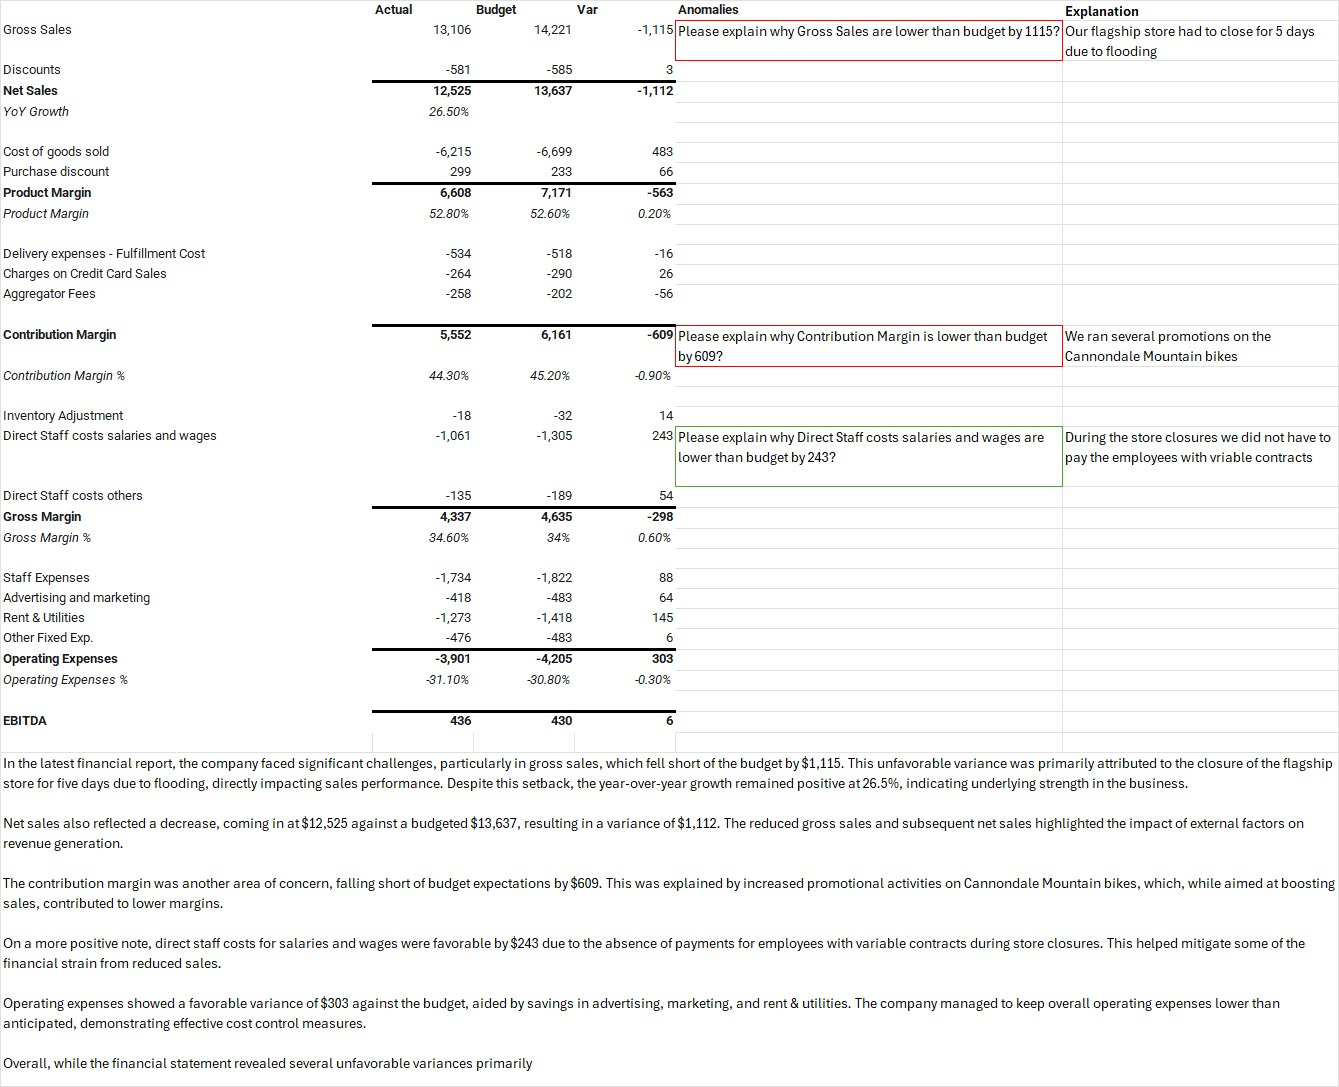
The AI used that context to generate a final management-ready commentary.
This wasn’t some fantasy workflow; this was real. From anomaly to narrative. From raw data to strategic communication. All inside Excel.
CFOs can find out what matters, explain why it happened, and then generate a narrative that tells the full picture automatically.
You can scale this easily
You can make it 5 (or more) anomalies instead of 3.
You can build prompts that generate new storylines as new data comes in.
And you can hand over the formulas to anyone who wants to replicate the process.
This is the starting point.
Today, I’ll show you exactly how to use Copilot in Excel to find anomalies and become better at financial storytelling.
Let’s dive in.
Finance Processes are Broken
Your team spends 60% of their time hunting data, reconciling numbers, and repeating monthly rituals that drain creativity and delay decisions.
Microsoft Copilot for Excel can become your next unfair advantage.
And you must learn it.
