How to use GPT-5 in finance (evidence-based)
2 GPT-5 Prompts for Saas Finance Dashboard + MRR forecast
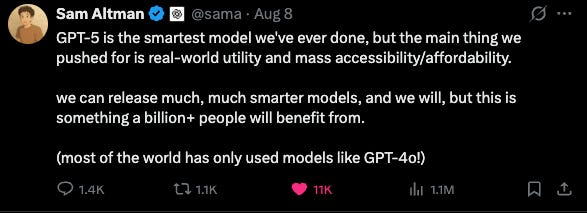
GPT-5 is here and it’s powerful.
OpenAI calls it their smartest, fastest, and most useful model yet.
For the first time, a single model blends instant responses with deep reasoning, switching between quick outputs and long-form expert analysis depending on the complexity of your question.
Every CFO and finance leader must know how to use GPT-5.
Here’s why:
400,000-token context window → Upload entire ERP exports, board decks, or policy documents and ask complex questions without breaking them into chunks.
45% lower hallucination rate vs GPT-4.0 → Fewer fact errors, more reliable analysis.
80% fewer reasoning errors when using thinking mode → Better for scenario planning and sensitivity analysis.
Faster execution → Handles complex calculations, reconciliations, and coding tasks in seconds.
I know GPT-5 doesn’t solve every finance pain.
But you must see superintelligence through the fog. You don’t have the road, fuel, or rules fully in place. That’s the truth and the frustration. But it’s on us finance builders, operators and parents to meet the moment with judgment, not slogans.
Jobs are getting squeezed.
Entry-level roles: some vanish; many compress.
Young builders: the best moment in history to ship alone and scale.
Late-career workers: the real risk. Retraining sounds noble, but it feels punishing.
GPT-5 lets you build faster than you can imagine. And you don’t need anybody’s permission to build and experiment.
In today’s edition, I’ll show you how GPT-5 can complete complex FP&A tasks in minutes… work that once took hours or days. I tested 2 impressive prompts for CFOs, both impossible in GPT-4:
1. I built a SaaS dashboard from scratch
With just 2 CSVs, actuals and budget. GPT-5 combined them and calculated MRR, ARR, EBITDA, gross margin, CAC, LTV, growth rates, Rule of 40…
Then built KPI cards with 12-month sparklines, red/green budget variance, and full trend charts. It zipped the app, and I deployed to Netlify with one click.
You can see the full dashboard here.
2. A driver-based MRR forecast
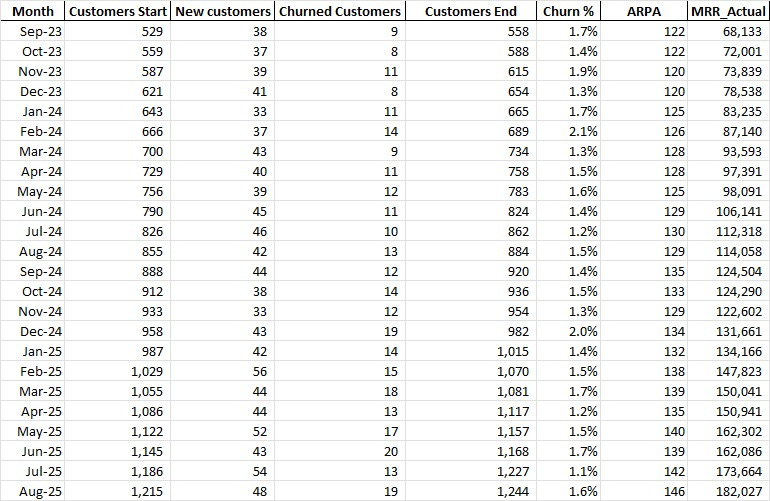
I pasted a simple table: new customers, churn, and ARPU. Told GPT-5 to statistically forecast some drivers and hard-set others. It built the forecast, picked the right method for each driver, and explained its reasoning.
Both ran in Thinking Mode, GPT-5’s deep reasoning setting for multi-step analysis.
If you’re a CFO still on the sidelines, someone else is already closing the books, forecasting, and preparing board decks at 10x your speed.
I’ll share with you the full prompts and walk you through so you can build and see the power of GPT-5 in finance.
Let’s dive in.
Previously, we built an interactive Board dashboard with financial storytelling. Yes, you can now prepare for your board meeting in 10 minutes with ChatGPT Agent.
How I used ChatGPT Agent to build an interactive Board Dashboard in 10 minutes
Financial storytelling is changing.
How To Build A driver-based MRR forecast
Imagine you run a SaaS company with a standard MRR waterfall. Every month, you win new customers, lose some to churn, and earn a set average revenue per customer (ARPU).
From those three inputs, you calculate your Monthly Recurring Revenue.
These are the real growth drivers:
New customers
Churn
ARPU
Here’s where GPT-5 comes in:
You can tell it to forecast each driver differently. Just like a seasoned FP&A analyst would. Some drivers can be statistically projected using methods like exponential smoothing. Others can be set as hard expectations based on known business plans.
COPY-PASTE Prompt
I want to make a 24 month MRR forecast using the data below.
We should do this by forecasting the new customers, the churn and the ARPA and then calculate the MRR by calculating the total customers for the future period and then multiplying it with the ARPA.
This is how I want you to treat each driver:
New customers --> use holt winters seasonal to forecast the next 24 months
Churn % --> use holt winters seasonal to forecast the next 24 months
ARPA --> 155 for the first 6 months, 175 for the 6 months after and 200 for the last 12 months
Output the following:
A table with the whole breakdown containing both Actual and Forecast
Two charts showing the holt winters forecast as a line chart containing both Actual and Forecast
A chart with the predicted MRR both Actual and Forecast
Month Customers Start New customers Churned Customers Customers End Churn % ARPA MRR_Actual
Sep-23 529 38 9 558 1.7% 122 68,133
Oct-23 559 37 8 588 1.4% 122 72,001
Nov-23 587 39 11 615 1.9% 120 73,839
Dec-23 621 41 8 654 1.3% 120 78,538
Jan-24 643 33 11 665 1.7% 125 83,235
Feb-24 666 37 14 689 2.1% 126 87,140
Mar-24 700 43 9 734 1.3% 128 93,593
Apr-24 729 40 11 758 1.5% 128 97,391
May-24 756 39 12 783 1.6% 125 98,091
Jun-24 790 45 11 824 1.4% 129 106,141
Jul-24 826 46 10 862 1.2% 130 112,318
Aug-24 855 42 13 884 1.5% 129 114,058
Sep-24 888 44 12 920 1.4% 135 124,504
Oct-24 912 38 14 936 1.5% 133 124,290
Nov-24 933 33 12 954 1.3% 129 122,602
Dec-24 958 43 19 982 2.0% 134 131,661
Jan-25 987 42 14 1,015 1.4% 132 134,166
Feb-25 1,029 56 15 1,070 1.5% 138 147,823
Mar-25 1,055 44 18 1,081 1.7% 139 150,041
Apr-25 1,086 44 13 1,117 1.2% 135 150,941
May-25 1,122 52 17 1,157 1.5% 140 162,302
Jun-25 1,145 43 20 1,168 1.7% 139 162,086
Jul-25 1,186 54 13 1,227 1.1% 142 173,664
Aug-25 1,215 48 19 1,244 1.6% 146 182,027
It thought for 1m 3s and then returned this table.
And the first two forecasted drivers.
It’s a simplified example and real-world models are more complex.
But the point stands:
You can treat each driver separately and tell GPT-5 exactly what you want in plain language without coding or being an Excel Guru. Just give it clear instructions on the output you need.
Let’s move on to the second prompt and build a SaaS Financial Dashboard.
How To Build a SaaS Financial Dashboard From Scratch
Files to upload:
COPY-PASTE Prompt
Please create a complete, ready-to-deploy web dashboard that visualizes my SaaS company’s financial performance. I will give you two CSV files: one with actual results and one with budget data. The dashboard should automatically combine both datasets based on the Month column, where each metric has two columns in the format <Metric>_Actual and <Metric>_Budget. Remove the suffix to get the base metric name. Metrics can include MRR, ARR, Revenue, COGS, Gross Margin %, Sales & Marketing, R&D, G&A, OpEx, EBITDA, EBITDA Margin, Customers, New Customers, Churn Rate, CAC, LTV, NRR %, GRR %, Magic Number, Rule of 40, and YoY Growth. If any derived metrics are missing, calculate them: Gross Margin % = 1 – (COGS / Revenue), OpEx = Sales & Marketing + R&D + G&A, EBITDA = Revenue – COGS – OpEx, EBITDA Margin = EBITDA / Revenue, Rule of 40 = YoY Growth + EBITDA Margin.
The layout should have:
A top row of KPI cards showing the most recent month’s results, a small sparkline of the last 12 months, and a green or red indicator to show if the result is better or worse than budget.
A set of clear, modern charts showing: MRR trend comparing actual to budget, Revenue versus expenses, Gross Margin % trend, CAC compared to LTV, EBITDA and EBITDA Margin.
A table showing budget versus actual variances with both value and percentage difference, using green for favorable and red for unfavorable results.
The style should be dark, clean, and professional with rounded cards, subtle shadows, and smooth animations. The design should be responsive, with all amounts formatted as currency or percentages where appropriate.
The output should be a single deployable folder containing everything needed for a React + Tailwind project, including HTML, CSS, JavaScript, and the CSV parsing logic. Place the CSV files in a public folder so they can be replaced later without touching the code. The final result should be provided as a ZIP file I can upload directly to Netlify for instant deployment.
After the prompt, GPT-5 instantly came up with this result.
You can see the full dashboard here.
Pretty amazing what’s possible with a single shot.
Right?
But you might be wondering, how did I get the dashboard in Netlify? Don’t worry. I’ll teach you how you can deploy to Netlify with one click.
Create a free Netlify account; on the home screen, click…
Add new project → Deploy manually
Simply drop the unzipped folder that ChatGPT gave you to download or select “browse” to select the folder.
3. Simply drop the unzipped folder that ChatGPT gave you to download or select browse to select the folder.
Upload takes a few settings and you can click the link of the app and test it.
You got it.
Now go ahead and try it.
Impress your CEO and the Board by mastering GPT-5.
The Bottom Line
GPT-4 was a fantastic analyst.
GPT-5 is your full finance operator.
It can build tools, run analysis, and explain its thinking faster.
Sam Altman said something that stuck with me:
Use the tools. Stop treating ChatGPT like a better search box. Push it into your work. Learn its edges. Build fluency now. Build resilience. The rate of change won’t slow for your comfort.
And that’s all for today.
See you on Thursday!
Whenever you're ready, there are 2 ways I can help you:
Promote your business to 22,000+ engaged CFOs and senior finance leaders by sponsoring this newsletter.
If you’re building an AI-powered CFO tech startup, I’d love to hear more and explore if it’s a fit for our investment portfolio.
I’m Wouter Born. A CFOTech investor, advisor, and founder of finstory.ai
Find me on LinkedIn