M&A integration 2: CFO with Claude
How I turned a $4.3M balance sheet problem into a reviewed and controller-ready mapping. In under an hour. With Claude Cowork.

Yesterday I walked through the CFO Integration Control Tower.
The governing view of the FullCycle × Summit integration on Day 53.
Today I am going one layer deeper into the first workstream. Chart of accounts and management reporting mapping.
How to run an M&A integration with Claude as a CFO

In 2018 I sold CXO Software to insightsoftware. A year later I was running the M&A function on the other side of the table.
This step is not about mapping account codes.
It is about answering one question.
How would Summit Reports appear inside FullCycle’s reporting model?
Which mappings are clean?
Which are ambiguous. Which management views and KPI definitions break the moment you try to force a simple mapping.
The goal is one strong artifact, not a document set.
One first draft of a single financial language.
Let’s dive in.
Chart of accounts and management reporting mapping
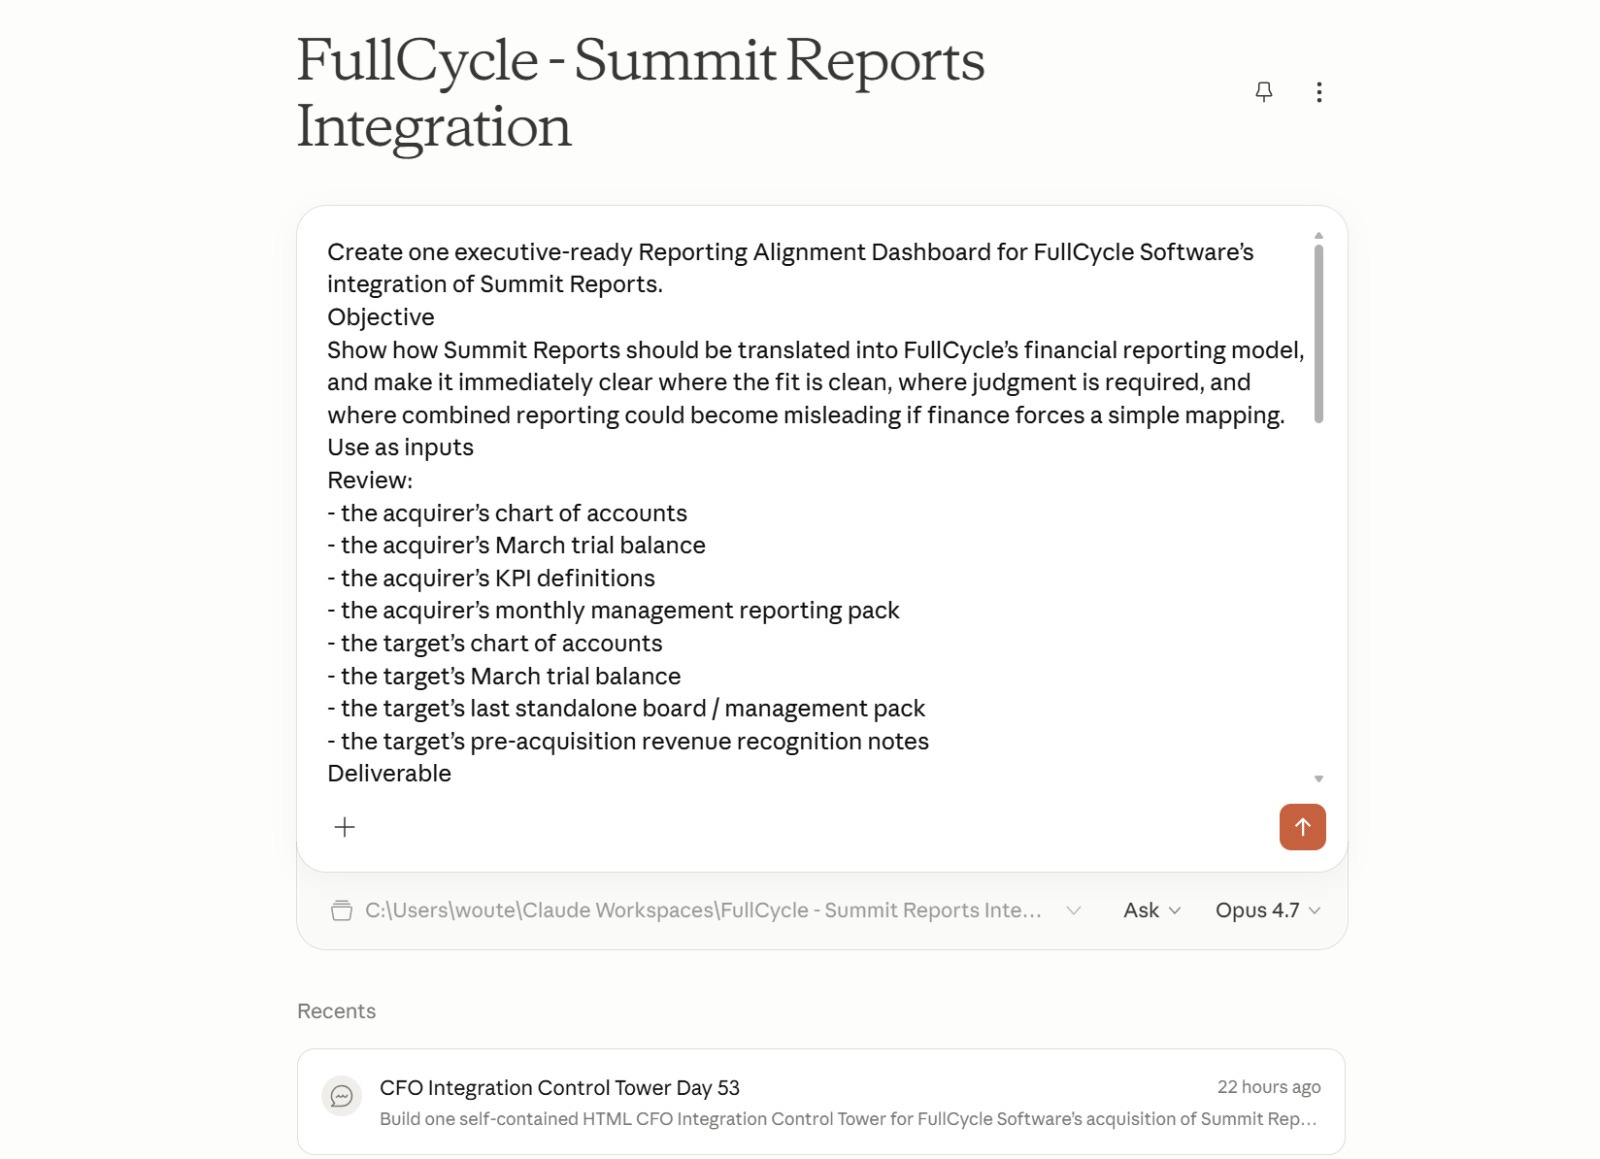
I opened a new conversation inside the same Cowork Project I built yesterday.
I did not need to re-explain anything. The Project already has memory. It knows where all the files are. It has the custom instructions I pasted yesterday. It remembers that we are on Day 54 of the FullCycle × Summit integration, that D. Park is the controller, and that the first combined close is in April.
If you want to follow along, download the refreshed zip. It contains yesterday's Control Tower dashboard plus all 54 sample files.
FullCycle - Summit Reports Integration - Step 2.zip
That is the point of a Project.
You build the context once. Every future conversation inherits it.